Flowcharts provide you with a broader picture of the process while assisting you in identifying the crucial steps when creating and planning a process. A variety of disciplines and businesses widely use different styles of flowcharts to visualize data.
However, it is important to choose the right one via many types of processes. Therefore, you can take advantage of different flowcharts to their fullest potential for the purposes you intend to visualize.
The blog is going to list and dive into more detail about the 15 most popular types of flowcharts and templates to help you familiarize yourself with them.
1. Process Flowchart
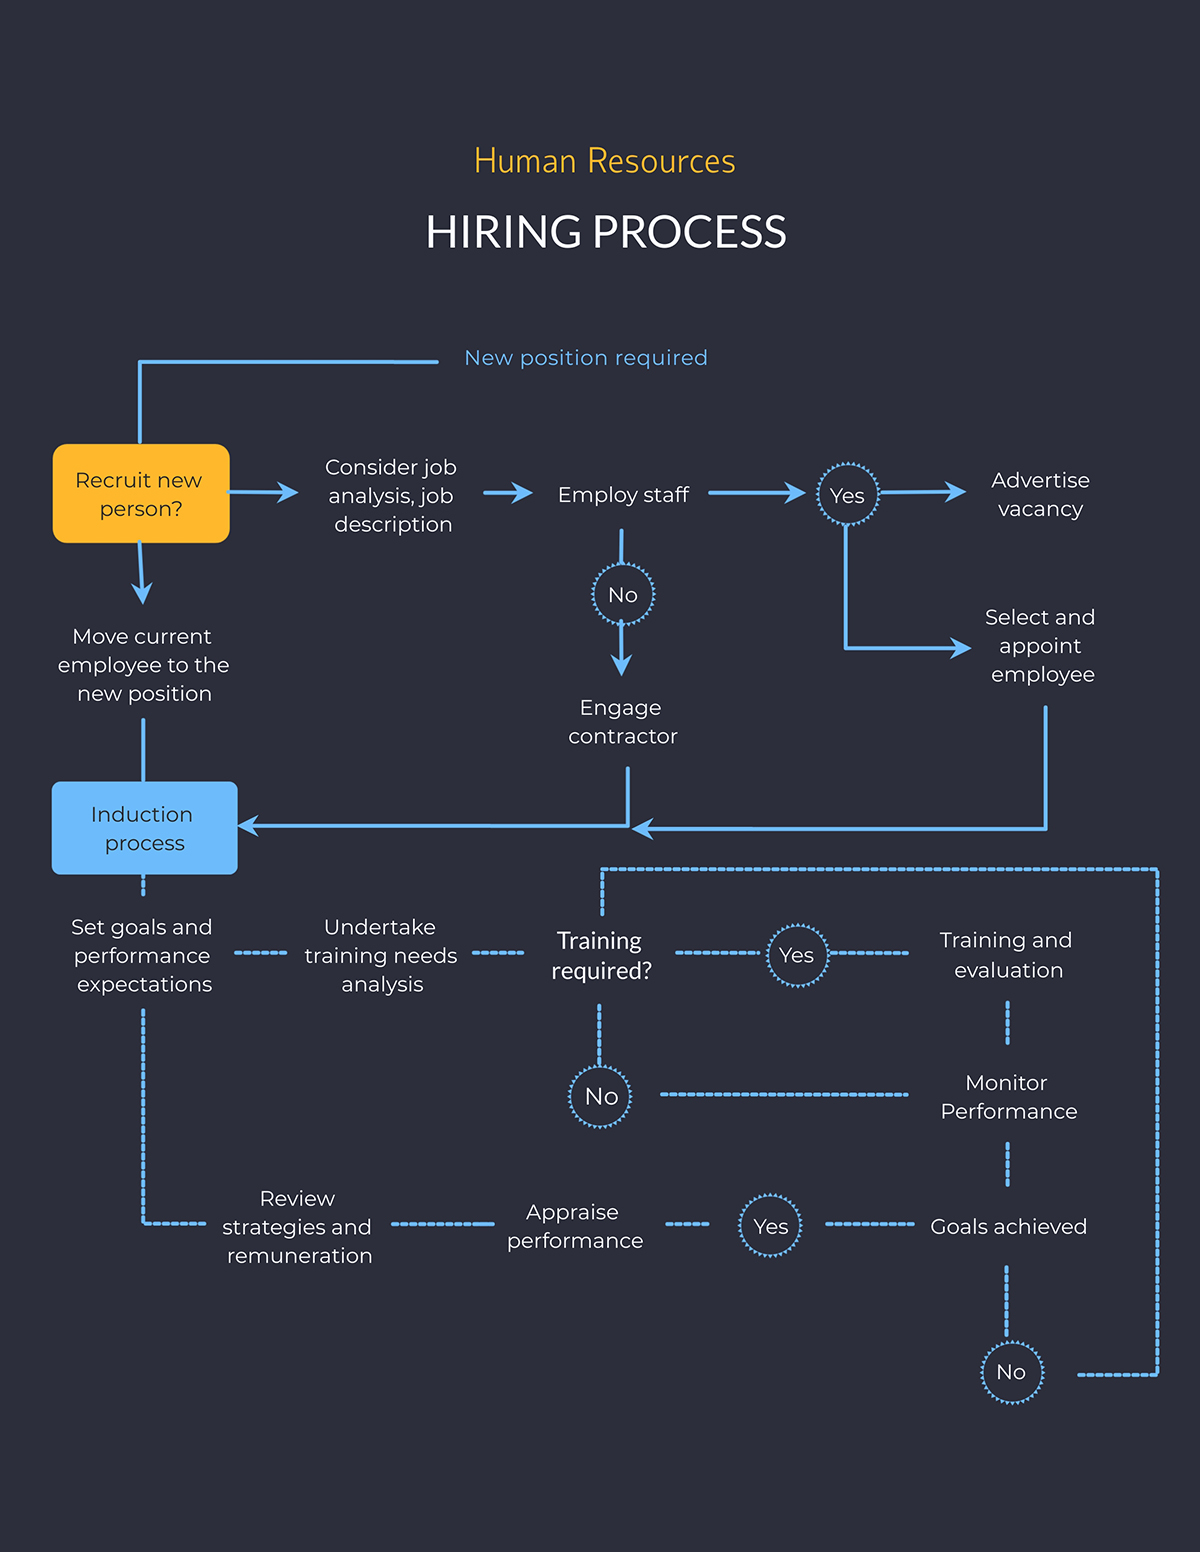
If you're having trouble keeping track of numerous types of details within a business or organization, a flowchart may be a good solution. It will assist you in organizing and visualizing your process, as well as illustrating the relationship between tasks and the personnel in charge of carrying them out.
A process flowchart depicts the steps and choices required to complete the process. Each stage is further indicated by shapes, which are linked by lines. The arrows on the lines indicate the progression and direction of the process.
To make the process you are attempting to visualize obviously, flowcharts follow a logical flow of information. The best part of these flowcharts is that they are simple to build.
Below is a process flowchart template that you can easily modify.
 2. Workflow Diagram
A workflow diagram offers a graphic summary of the process you're seeking to visualize, just like a process flowchart does. A workflow diagram, like a process flowchart, uses standardized symbols and shapes to represent the process step-by-step. People frequently use these two names interchangeably because of their similar characteristics.
Even so, a workflow diagram outlines an instruction of items, which is how it differs from a process flowchart. A process flowchart, on the other hand, illustrates a procedure. The figure also indicates who is in charge of the task at each stage of the process.
To put it differently, a workflow diagram displays what is happening in the workflow, while a process flowchart depicts the procedures that alter the state of an object.
To help employees clarify their roles and duties as well as more closely connect the various departments, these diagrams are good options.

3. Swimlane Flowchart
One of the most common flowchart designs to display who is in charge of what phase of a process is a swimlane flowchart. Its name comes from a swimming pool's lanes. In this flowchart, each lane represents an area for a department or business role.
This flowchart divides the processes into different channels based on each channel's area of responsibility. Therefore, you can make it simpler for each department to understand what they need to do.
As a result, teams find this kind of flowchart to be a useful tool for ensuring that at no point in the process do they come to an end. Department-rich organizations use swimlane diagrams generally to demonstrate the cooperative business process.
However, to eliminate confusion regarding who owns which part of a process, anyone can apply these flowcharts.

4. Data Flow Diagram
One of the most crucial tools for the structural analysis and design of information systems is the data flow diagram, often known as the data flowchart. It is a visual representation of how data flows through any system or process. To represent data input and output, it uses symbols like rectangles, circles, and arrows.
The design and development of software often employ these flowcharts. But there are many different ways you can apply this flowchart. Use it for system topologies, agile development, business process re-engineering, and many other things.
The interactions among the elements of structure in the same notation can be displayed on a separate diagram since each step may be subject to decomposition in this diagram.

5. System Flowchart
System flowcharts, as the name implies, explain how a system or program works and interacts. These flowcharts resemble data flow diagrams or data flowcharts greatly. This flowchart shows how data flows through a system, similar to data flowcharts.
Additionally, it connects the symbols used to represent the data flow to demonstrate what happens to the data and where it travels. Data flowcharts, on the other hand, just depict the path, not the decisions, which is a fundamental distinction between these two.
The best way to physically depict the system and show inputs, outputs, and processes is through a system flowchart. Consequently, it serves as a useful tool for monitoring information and managing initiatives as they happen.
 6. Decision Flowchart
If you have trouble making a rational choice quickly, a decision flowchart can be a solution, especially if making decisions is a regular part of your day.
One of the most common flowcharts is a decision flowchart, which aids in making decisions in the proper sequence. You can use it to see every conceivable result of your process and make sure that you've chosen wisely.
Therefore, you should be familiar with these flowcharts if you are a business owner, project manager, or other professional with decision-making duties.
It can assist you in visualizing the variety of processes involving cross-functional or interdepartmental teams, help team members understand their roles, help team members make decisions based on the information they get along the way, and much more.

7. Business Process Modeling Diagram
A business process modeling diagram or business process modeling notation is a type of flowchart that shows the step-by-step strategy of a business. It provides the stakeholders with a visual depiction of the steps involved by visually illustrating a thorough sequence of business activities and information.
Compared to narrative texts, these sorts of flowcharts are simpler to read, allowing better communication and teamwork that will help you complete your business process and produce high-quality results.
 8. The SDL Flowchart
SDL, or specification and description language, is a modeling language used in the automotive, aerospace, medical, and communications industries to create object-oriented diagrams for state machines.
There is a certain set of symbols used in the flowchart. The three main parts of the SDL are system definition, block, and process. The best purpose for these flowcharts is brainstorming, particularly when developing new computer algorithms.
Furthermore, the flowchart's visual representation of each stage makes it a perfect tool to fix common errors.

9. Use Case Flowchart
Use case flowchart or use case diagram is a term used to describe how a system interacts with external things. They can provide a detailed account of how users of your system have interacted with it.
A use case diagram primarily consists of three elements: actors, systems, and goals. Users who engage with the system are known as "actors." A system is the precise pattern of the actions and interactions between actors and the system, and goals are the outcome of the use case.
A use case diagram gives you a bird's-eye view of your system and can serve as the design for it. You can use the diagram as a useful communication tool for the stakeholders because it is straightforward in design.
 10. EPC Flowchart
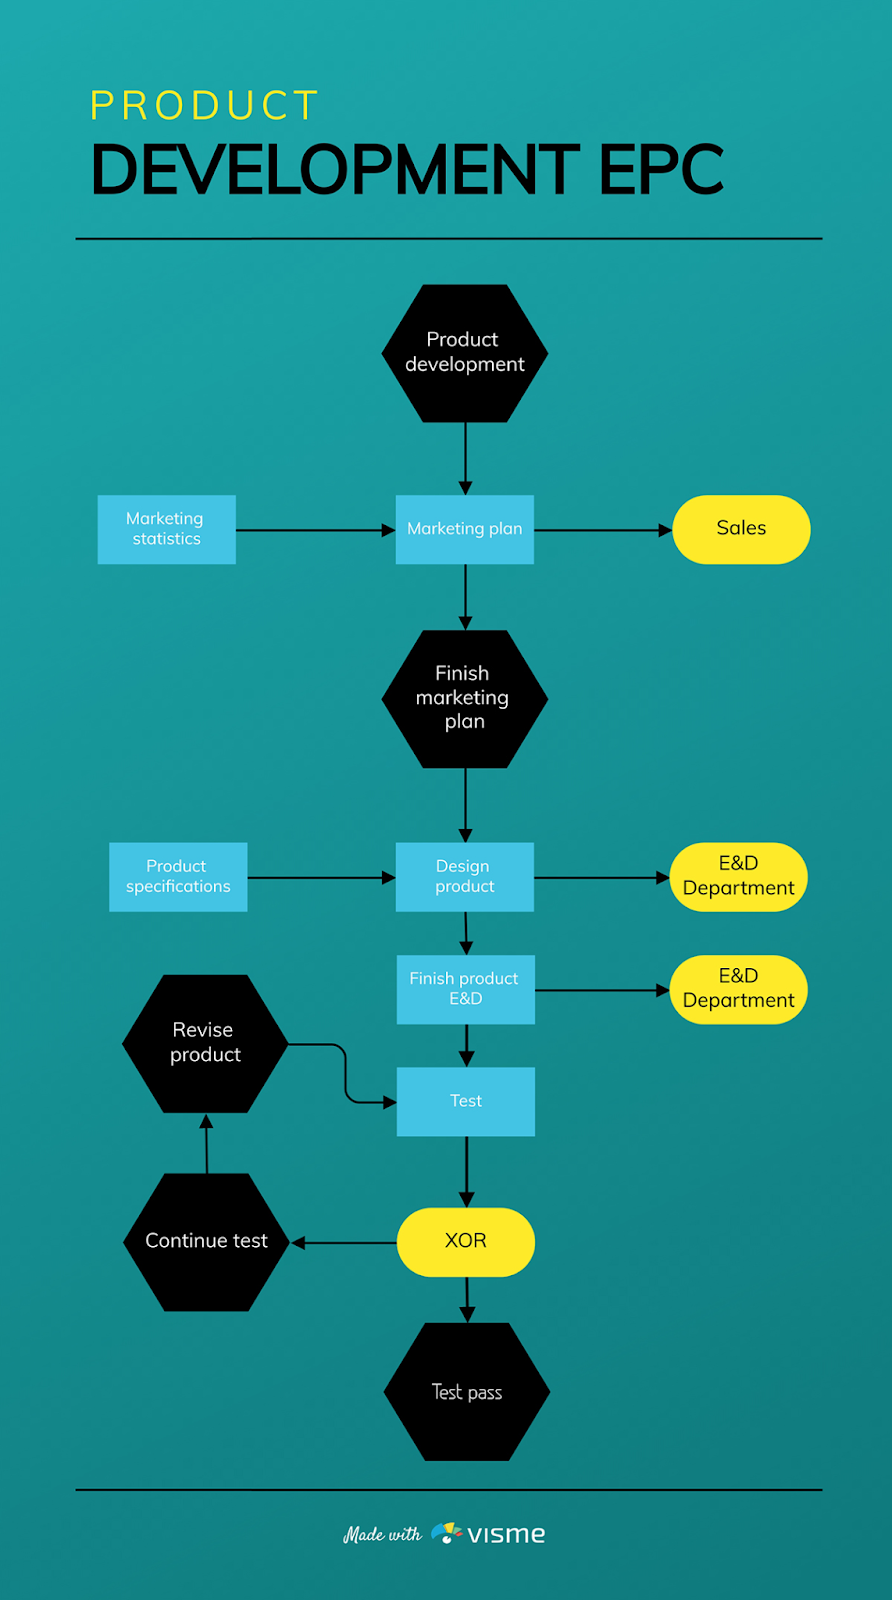
Your business's process does actually involve a wide range of tasks. Some may be straightforward, while others may be complex, creating a variety of circumstances. Modeling your business processes is the best way to guarantee an outcome that is consistent and predictable.
In order to model a business process, an EPC flowchart uses events and functions as its main components. The visual organizer known as EPC, or event-driven process chain, aids in redesigning business procedures to increase productivity throughout your entire company.
11. Process Map Flowchart
A process map flowchart is a diagram that shows each step and choice made during a process. In other words, it's a thorough flowchart that can aid in process auditing. By providing you with insight into the information flow and the tasks involved in the process, it helps you make the best decisions at the right time.
In the disciplines of software and electronics, these kinds of flowcharts can be incredibly helpful for debugging issues or identifying a malfunctioning system. Process map flowcharts are additionally used by organizations for improvement.
You can evaluate processes carefully with the help of the flowchart to identify areas for improvement and operational inefficiencies.

12. Cross-Functional Flowchart
You already know as a business owner that business processes involve several departments and stakeholders. Additionally, the involvement of several stakeholders and feedback from various teams make the business process more difficult.
A cross-functional flowchart is specifically made to define who does what on the lower level of a business model in order to clarify the processes. These flowcharts also show the members of the team and how they interact during the execution of a business process.

13. IDEF Flowchart
In the software engineering domain, IDEF (Integrated Definition) is a graphical method that aids in the modeling of complicated systems. The IDEF0 - IDEF14 family of modeling languages covers a wide range of applications, from object-oriented analysis to functional modeling and data gathering.
IDEF0 is A non-proprietary diagramming method with strict specifications. There are boxes with function displays and arrows leading to and from the function in each box.
As seen in the template below, IDEF flowcharts' primary elements are the arrow, box, context, and node trees.
 14. Influence Diagram
If you need a tool that can visually and mathematically describe your choice, there is an influence diagram that shows what influences the decisions. As a result, because they are hierarchical, these flowcharts are a great substitute for the decision tree.
You can made this diagram in advance of the meeting. So that, people can discuss business ideas more effectively. It will show how choices are made, how the many outcomes are related, what the variables are, and how one step affects the others..
Here is an example.
 15. Value Stream Mapping
Value stream mapping is essential for the lean manufacturing method in business.
A sort of flowchart called a value stream map shows and evaluates the processes involved in a manufacturing or delivery process. Its main goal is to find and eliminate waste in the value stream in order to make that value stream more efficient.
Many industries, including product development, software development, manufacturing, healthcare, and many more, employ it because it's an effective approach to depict the main goals of the lean methodology.

Let flowchart boots your work
Hopefully, this blog of GO will help you take a closer look at these common types of flowcharts. Moreover, it could help you find the most suitable one for you or your business.
With flowcharts, you can visualize an idea, memorize a business process, or picture an idea. It's time to try to use flowcharts to increase efficiency in your workflow.
Source: Visme


